LAGRANTO.ECMWF

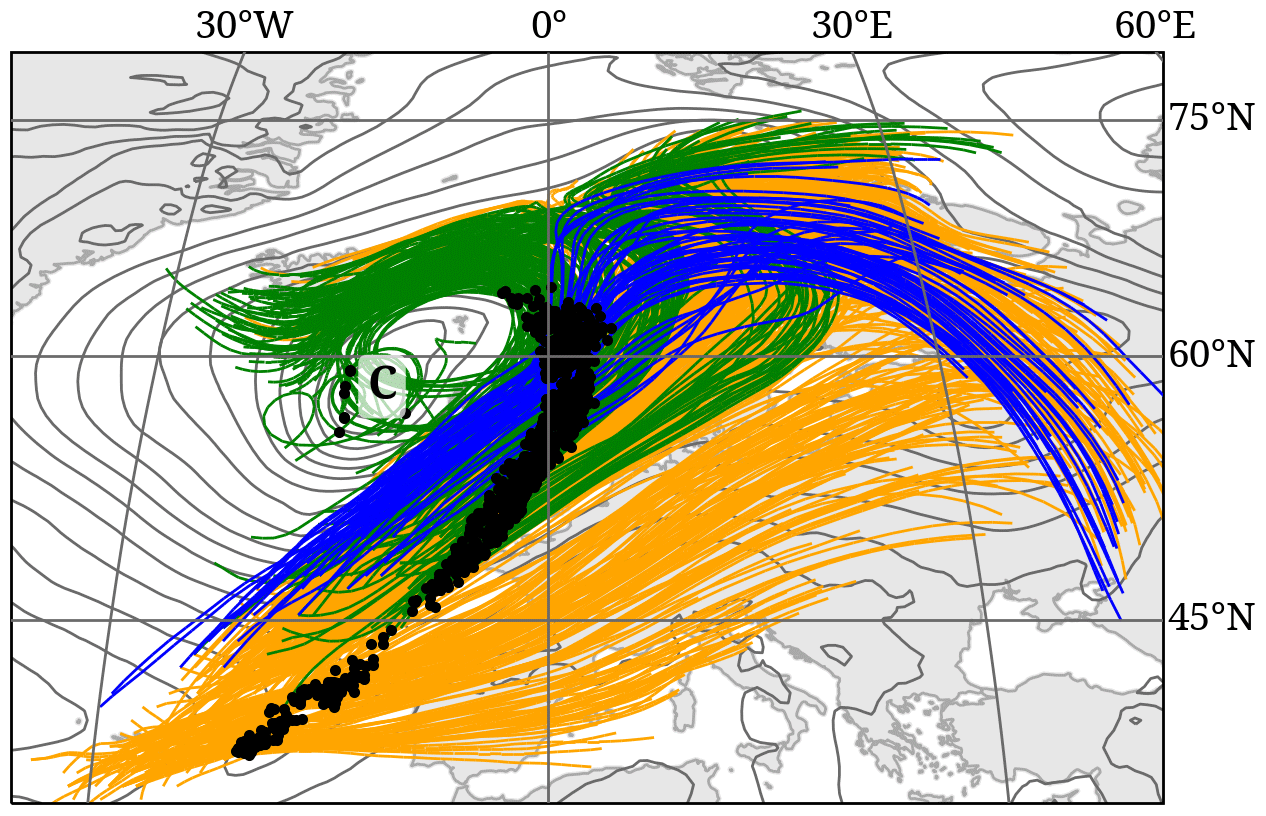
The 48 h WCB trajectories for the dichotomous WCB case described by Martínez-Alvarado et al. (2014),
located between 500–800 hPa at 00:00 UTC on 25 November 2009 (black dots) and ascending cyclonically (green),
anticyclonically (blue), or without a distinct curvature (orange). The letter “C” marks the position of the cyclone center,
and the grey contours show SLP (every 4 hPa) at 00:00 UTC on 25 November 2009.
LAGRANTO.COSMO

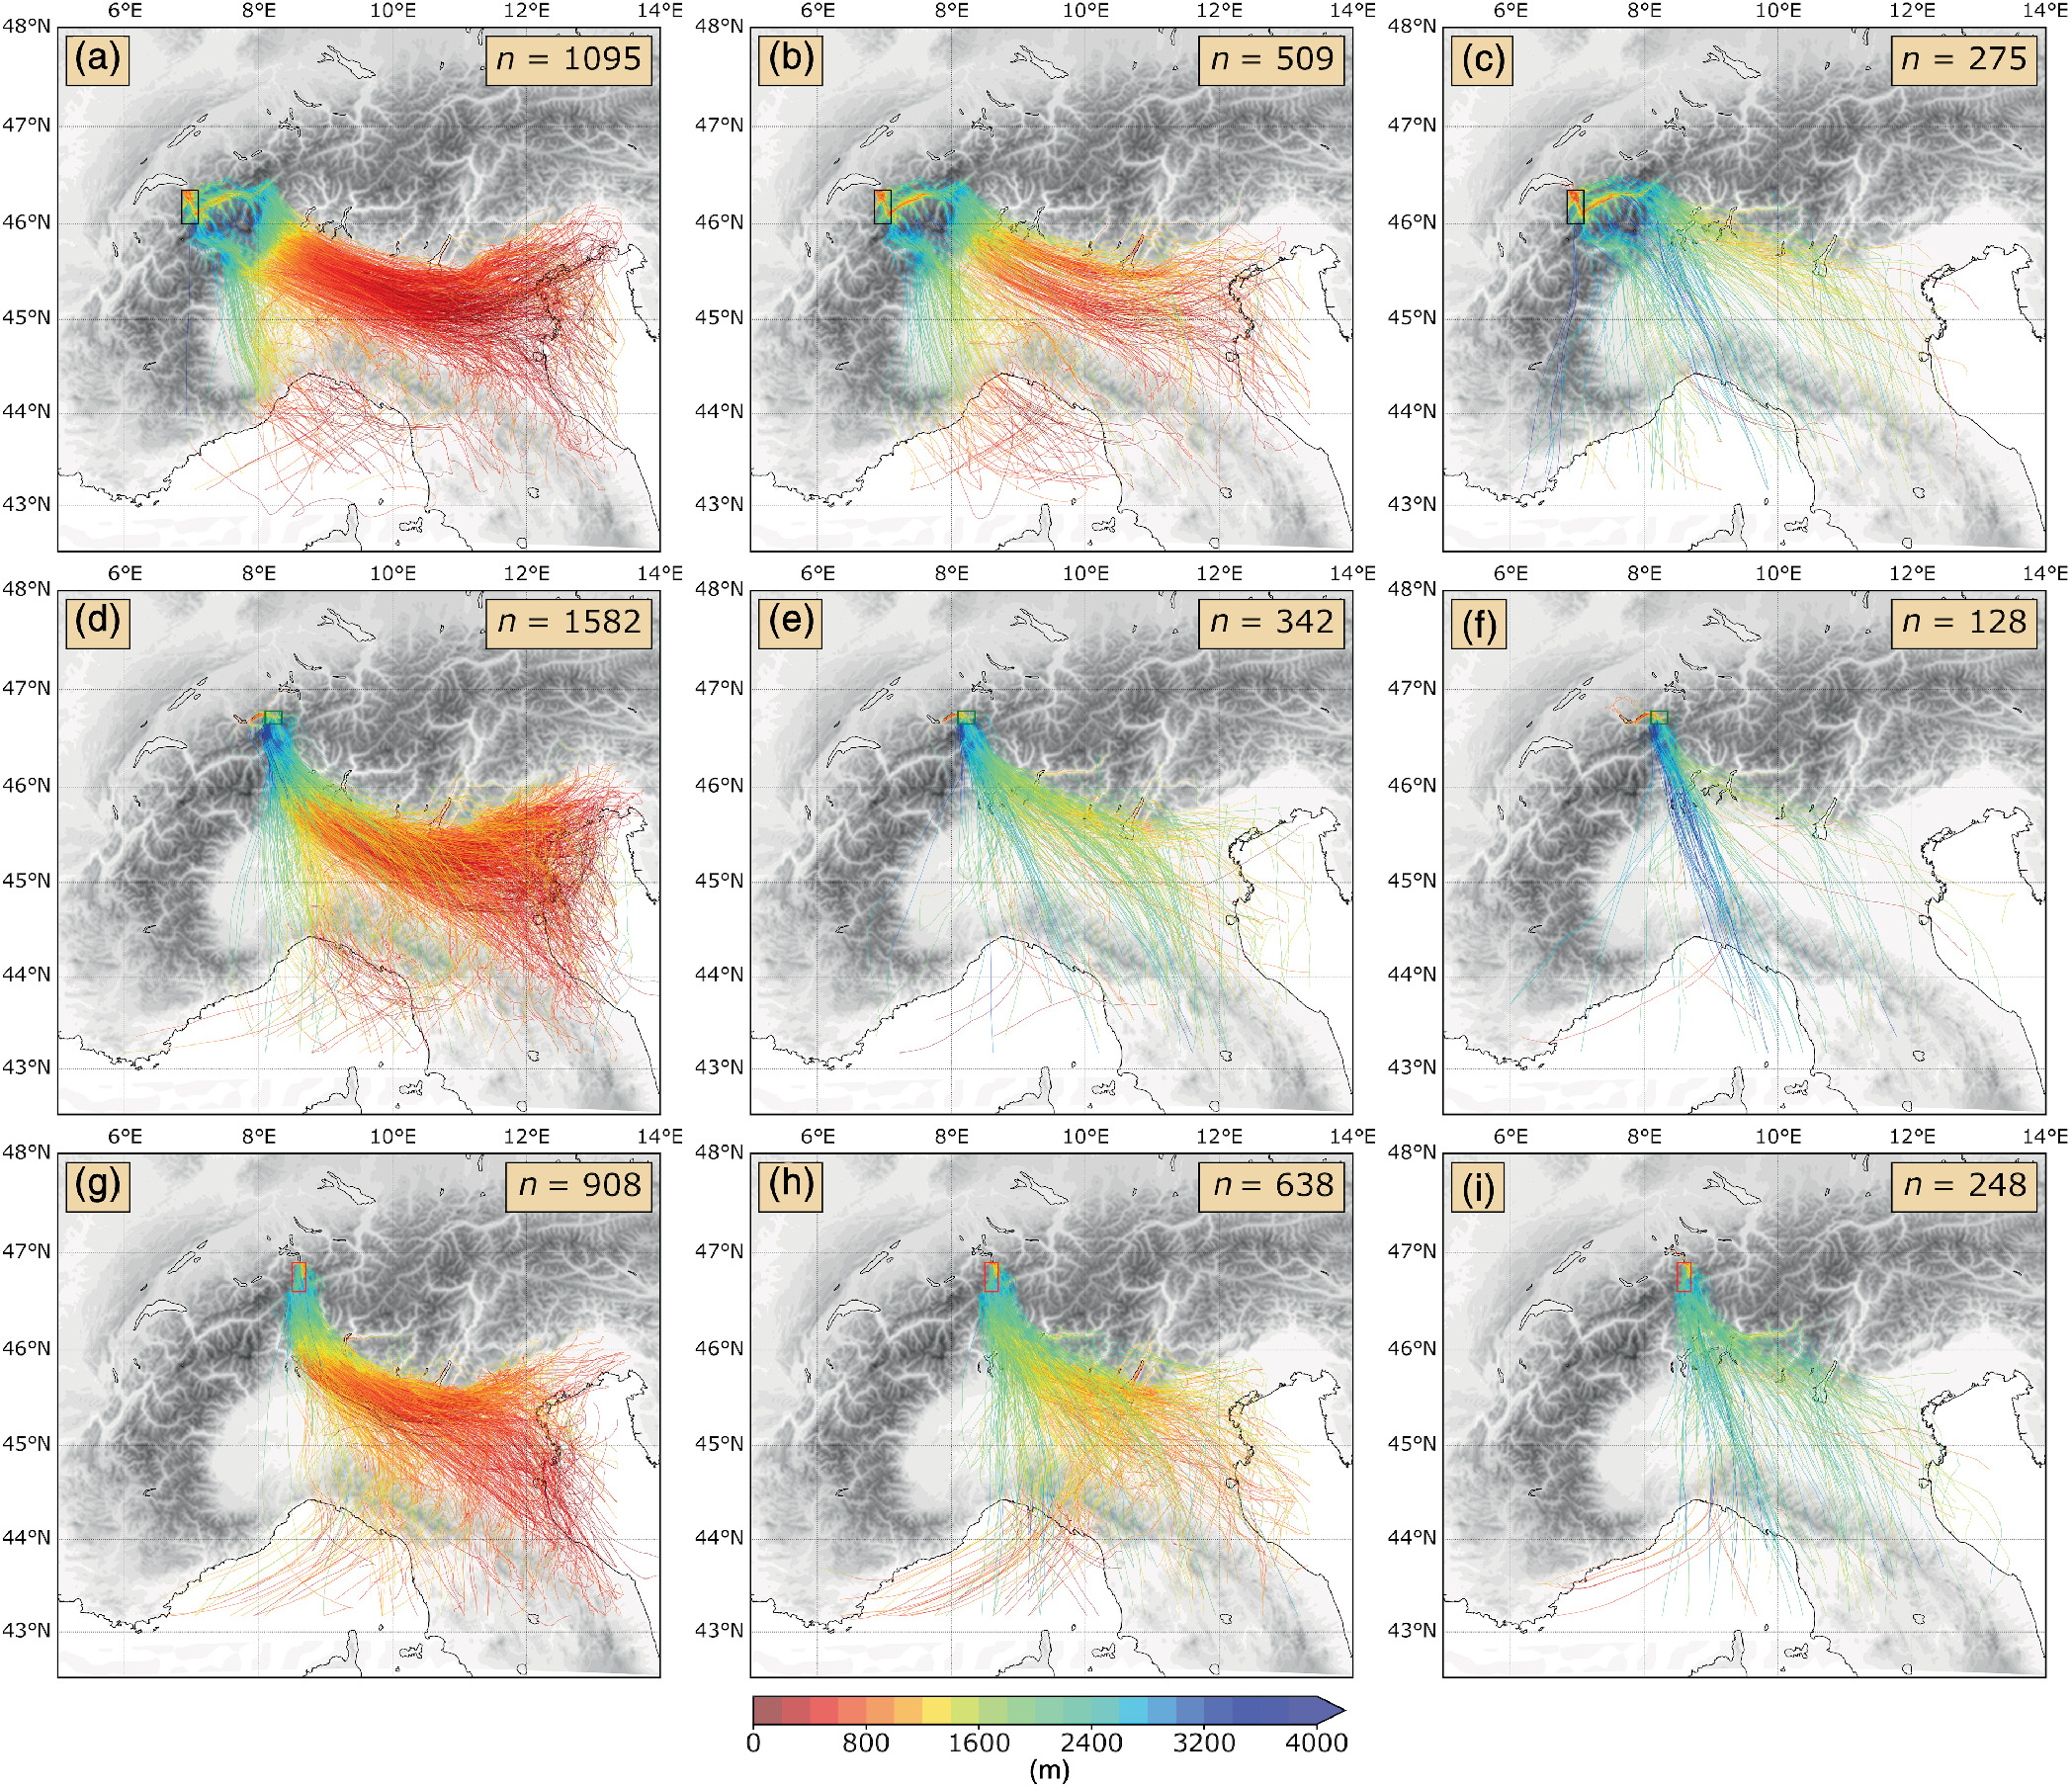
Thermodynamic trajectory classifications for (a)–(c) the Lower Valais, (d)–(f) the Hasli Valley, and (g)–(i) the Reuss Valley. Strongly heated airstream: right column; weakly heated airstream: centre column; cooled airstream: left column. The number of trajectories
within each category and for each valley is given in the upper right corner.
LAGRANTO.CESM

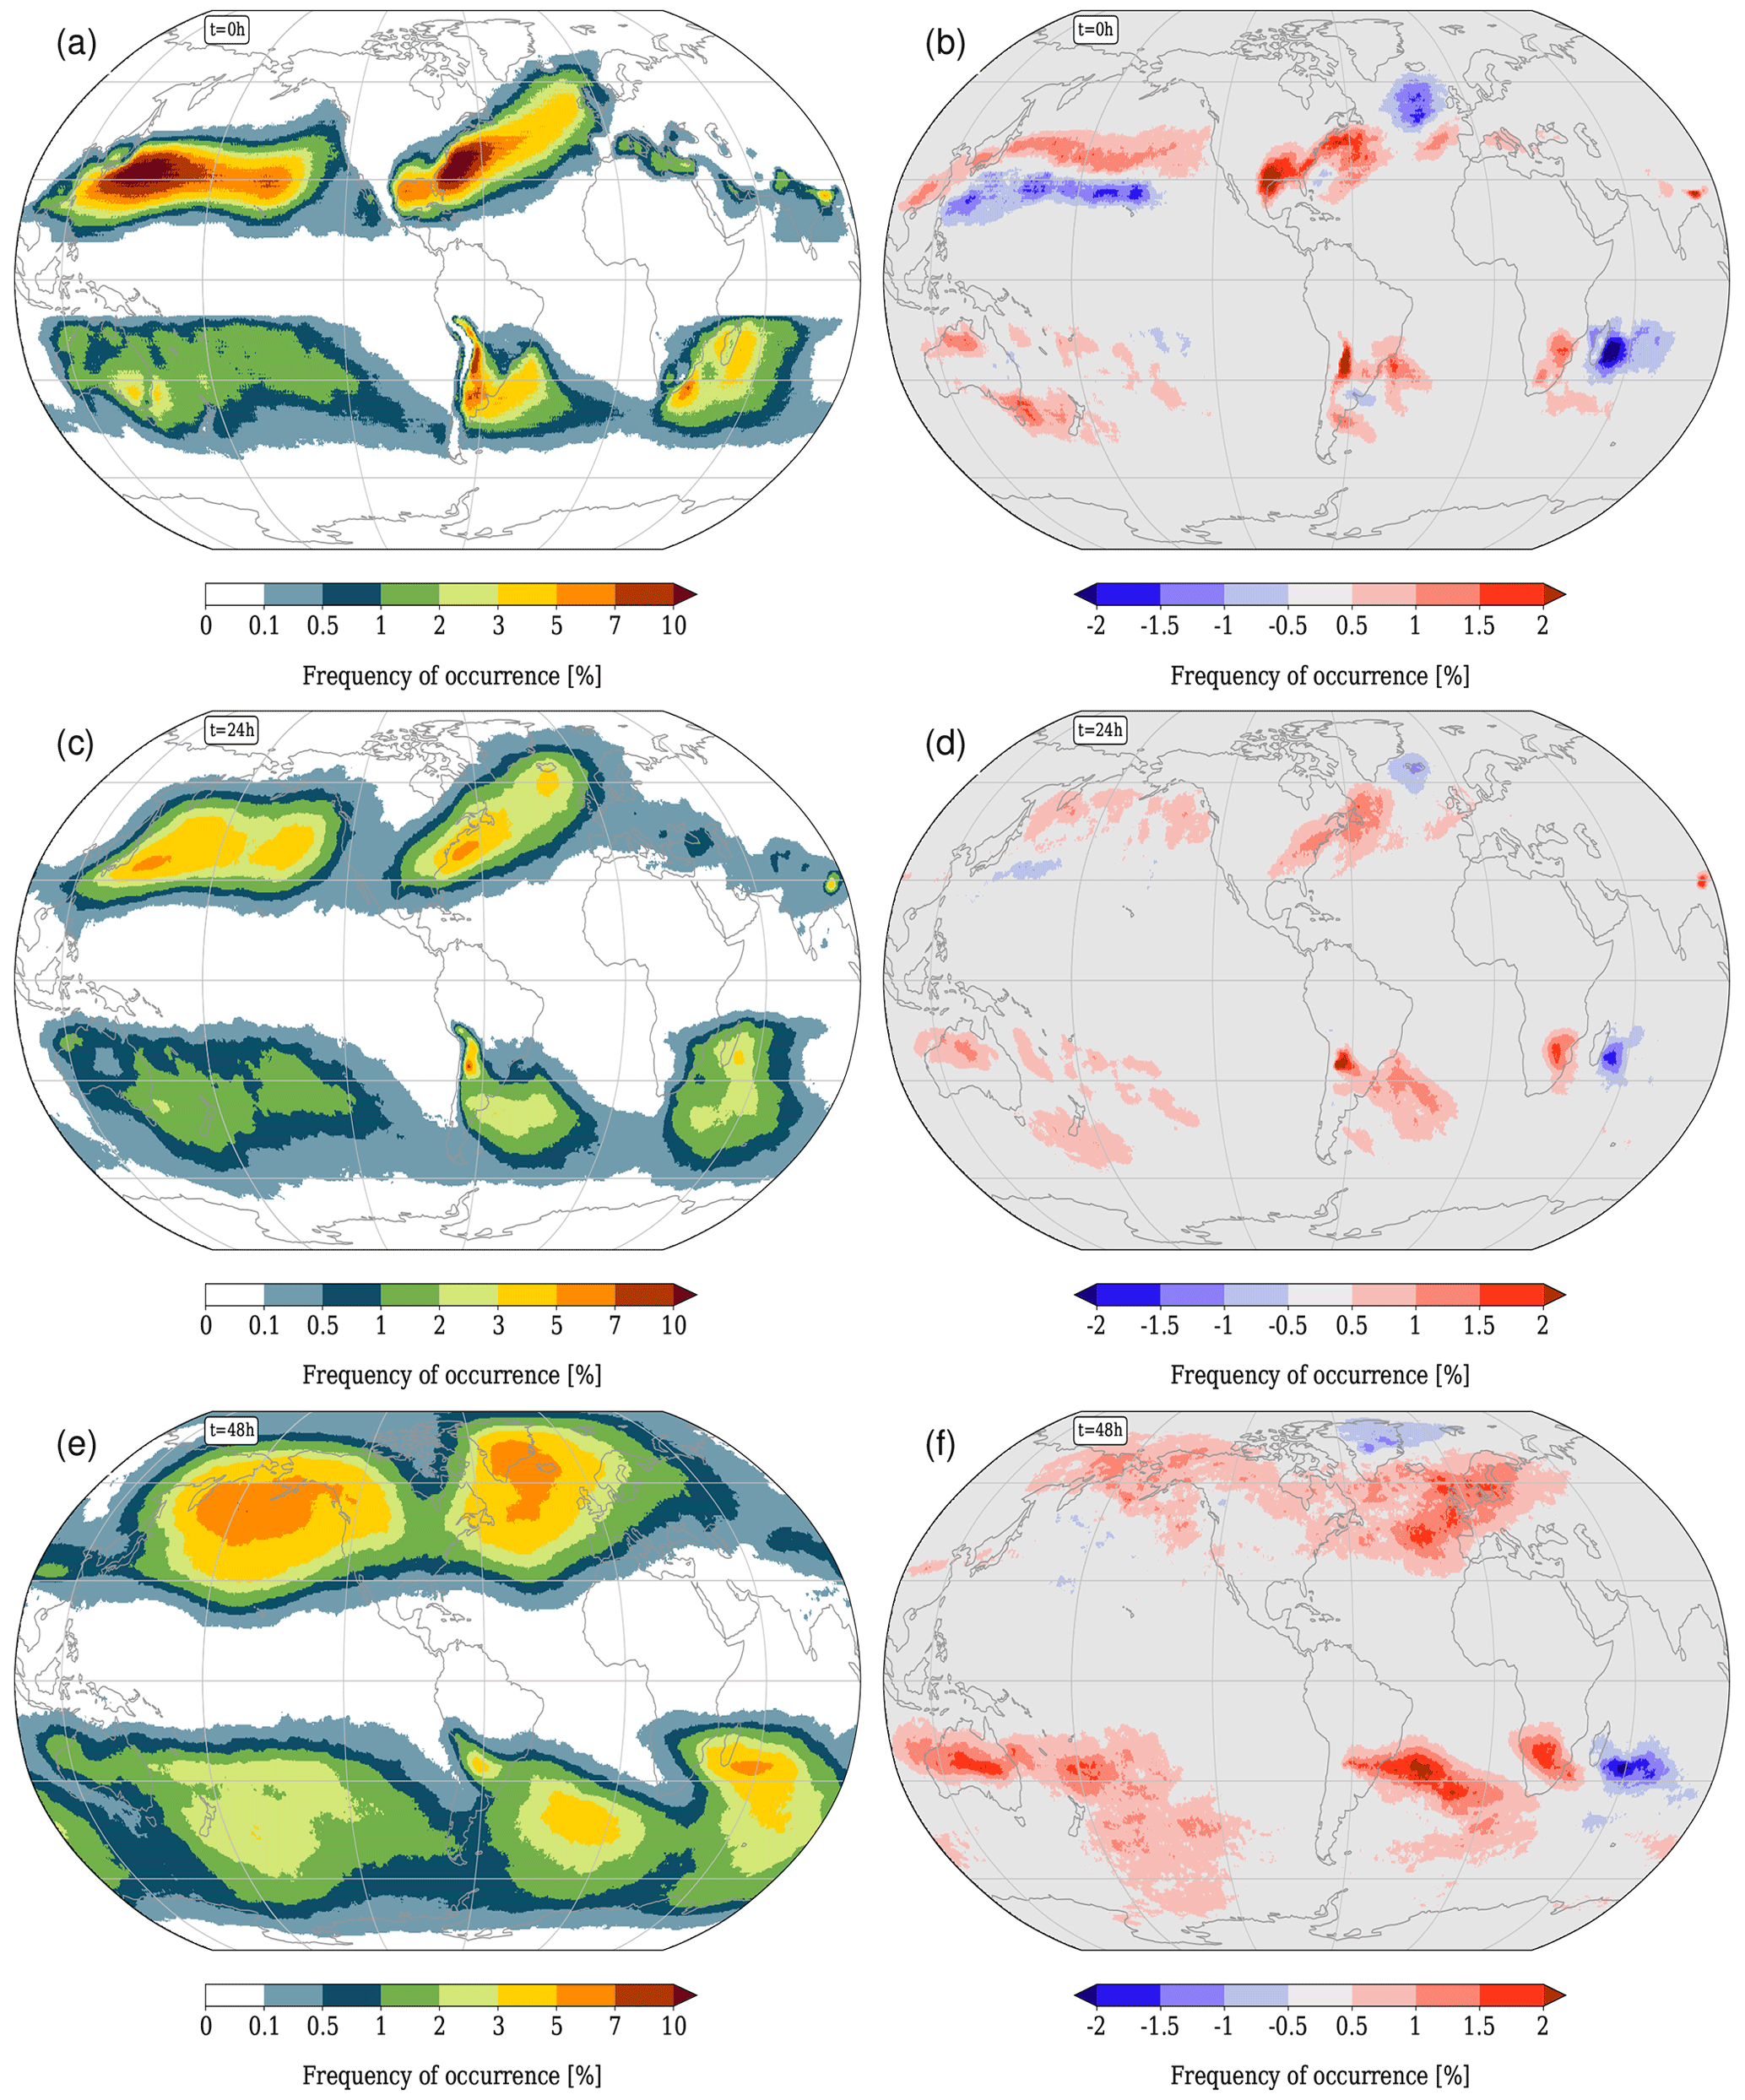
Absolute values of WCB frequencies (in %) for HIST (a, c, e) and difference RCP8.5 − HIST during boreal winter
(DJF) for WCB ascent times t=0 h (a, b), t=24 h (c, d), and t=48 h (e, f).